How much more revenue could your sales, marketing, and customer success teams drive for the business if all their processes, data, and reporting were optimized? We created this Revenue Operations ROI Calculator to help you find out.
As stated in a previous blog article, revenue operations aligns “sales, marketing, and customer success focusing on their processes, integrations, and reporting, encompassing how a lead or prospect progresses through the funnel across the three teams.”
When your technologies are not integrated and your processes are not aligned across sales, marketing, and customer success, your teams spend too much of their time executing manual processes and tracking down data across disparate systems. This inhibits your access to reliable data, slows down your funnel, and limits the amount of potential revenue that your team could be driving.
The Revenue Operations ROI Calculator focuses on these common challenges and highlights how it is impacting your team, and the potential revenue they could attain if everything was optimized.
Common Challenges to Solve for Revenue Operations
Today’s tech stacks are complex. According to Stackbeam, small businesses from 1 – 20 employees use on average 13 martech tools, it’s over double for mid-size companies that use on average 27 and that is just in the marketing department. We live in a world where new technology is so readily available and AI platforms can write your Apex code, legal documents, and emails. However, when you acquire so many tools in such a short amount of time and do not properly create a strategy for how each system will fit into your processes and how it will connect to the technologies you already have, it can create a ripple effect of issues.
#1
Inaccurate Reports from Disparate Systems
Have you ever thought, “Our data is everywhere.” or felt overwhelmed by the amount of data that you have, or are frustrated at how difficult it is to just get access to reliable data in real-time, so that you can accurately forecast or make strategic budgeting decisions? Go-to-market leaders everywhere have felt your pain, because this is very common when data is scattered across disparate systems which happens all too often.
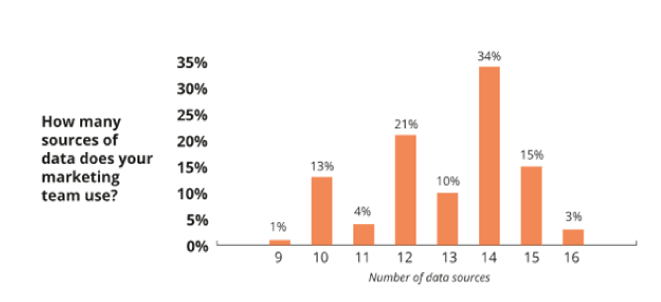
Adverity surveyed 300 CMO’s and 67% of them said they are overwhelmed with data. It is no wonder because that same study revealed that the majority of them have 14 different data sources that they are trying to extract insights from. HubSpot revealed that marketers spend three and a half hours of their week just trying to collect, organize, and track down all the data they need for reporting. On the sales side, reps are spending about two and half hours of their week on forecasting, yet 75% of the time it is inaccurate.
The results from Adverity’s study, Recession, Resilience, and Marketing Data.
When your data is not flowing from one system to the next, your team is forced to track it down manually, which leads to delayed and inaccurate insights. It poses a bigger challenge to make well-informed decisions for the business.
How many hours is your team spending managing and tracking down the data across your tech stack? The Revenue Operations ROI Calculator will tell you and it will show you how much time you could be saving.
#2
Manual and Misaligned Processes
Aside from all the time and frustration that your team is taking to track down data, they are also having to spend a great deal of time on manual processes that can easily get misaligned because of siloed systems.
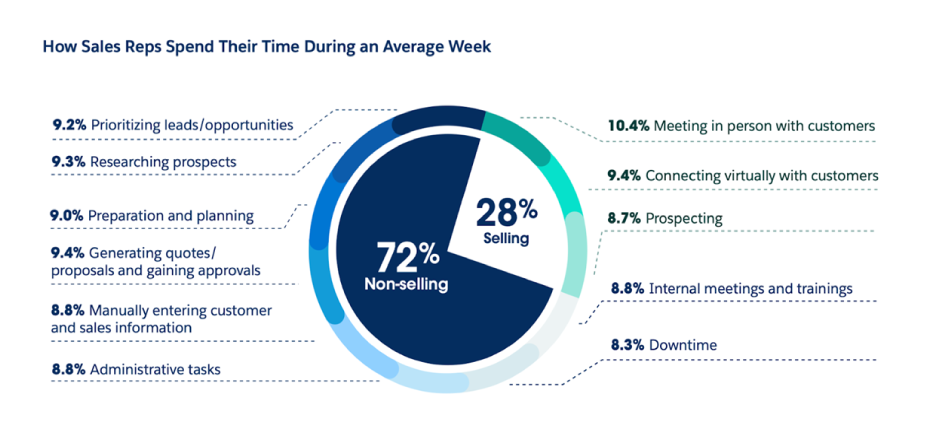
The 2022 Salesforce State of Sales Report revealed that sales spends less than 30% of their time selling and they are using an average of 10 tools during their sales process. A huge chunk of the other 70% is spent on manual and administrative tasks. How much time could your sales reps save if their contract, scheduling, and sales engagement platforms were all integrated with the CRM for a fully optimized sales process? Better yet, how much faster would your sales cycles be?
Source: Salesforce State of Sales Report p. 14
On the marketing side, what does your lead qualification and routing process look like? Have the processes been defined to automatically execute in your CRM and marketing automation systems? If not, then someone on the marketing or sales team has to spend their time managing an inbound lead queue manually. This slows down your rate of speed to lead which then leads to lower conversion and missed opportunities.
In addition to siloed systems taking up more of your team’s time, it also leads to misalignment which can become evident when it comes to the buyer and customer experience you provide. For example, if marketing’s data is not automatically updated that a prospect is in the final stages of your deal process and marketing sends out an email promoting a new discount on your services, this is going to cause friction with the sales team.
Even worse things can happen if you let your imagination run, but this is just one example of a negative effect from siloed systems.
#3
High Operational Costs Across Go-to-Market
Another challenge that the Revenue Operations ROI calculator showcases is high operational costs.
Your operational costs start to skyrocket when your team’s time is being taken up by manual and mundane tasks and your tech stack continues to grow without being integrated with the rest of your go-to-market systems and processes.
The Revenue Operations ROI calculator shows how much you are spending in operational costs in terms of your team’s time, by taking the average hourly pay rate of a revenue operations manager. However, it does not address the amount your technology is costing you. Instead it takes the amount of systems that you have and how many of them you have connected to each other to factor in how much time your team is spending managing and executing tasks with your siloed systems.
The return on your technology is limited when it is underutilized and the data it captures does not feed into your other systems. Gartner Marketing Technology Survey of 2019 showed that 42% of the martech stack is going unused. That is just the marketing department. How many sales tools do you have that your reps have not logged into in the past three months?
Source: Martech Zone
How many systems in your tech stack are your teams actually using? What is providing critical data? Which systems are enabling your teams to be as efficient as possible? Which systems have overlapping features? Which systems still need to be integrated and what could be consolidated?
These are the questions that you can begin to ask yourself when considering what optimizations you could start with when it comes to your tech stack and reducing operational costs. Then the Revenue Operations ROI calculator can show you the cost savings and the potential revenue you could drive as a result.
The Return on Your Optimization Investment
Similar to how our marketing and sales ROI calculators take the time that is saved from fully optimized processes and allocate it towards either selling or executing more revenue driving campaigns, the same goes for our revenue operations ROI calculator.
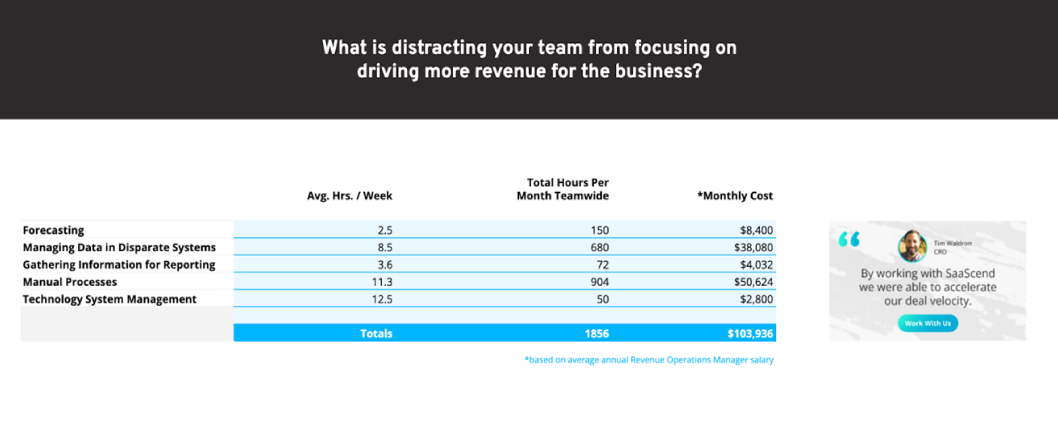
For example, let’s say a company has 5 marketers, 15 salespeople, 20 systems in their tech stack and only 3 of them are integrated. Taking the averages from the research and first-hand experience used to create the calculator, a team of this size will spend 1,856 hours per month on processes that could be optimized such as managing data in disparate systems, gathering information for reporting, and manual processes.
The Revenue Operations ROI Calculator highlighting what inhibitors are keeping your team from reaching their peak revenue potential.
If all of those processes were reduced down to take up only one-third of the original time spent, this team could gain back 1,299 hours across sales and marketing each month.
Taking this same example with that time gained back, marketing could potentially launch 10 more revenue driving campaigns. If this team on average generates 200 leads per campaign, has an average deal size of $60,000 and an average close rate of 30%, they could close about $600,000 more per month. The breakdown of the math is included below.
Assuming it takes on average 3 weeks to launch a campaign, 120 work hours:
1,299 / 120 = ~10 campaigns
200 leads x 10 campaigns = 2,000 leads
The average lead to pipeline conversion rate in B2B tech is 1.7%.
2,000 x 0.017 = 34 leads that converted into opportunities
34 x 0.3 = ~10 closed won deals
10 x $60,000 = $600,000
The Revenue Operations ROI calculator is meant to be a resource for you to see the world of what could be possible if your systems, processes, and data were fully optimized across your go-to-market teams. When you first access it, you can make a copy of it for yourself and play around with the numbers to test out different scenarios and start visualizing your team’s revenue potential.

It’s now way easier to forecast and make strategic decisions.
Alex Gannon, Director of Revenue Operations & Strategy


